Australia’s housing values increase in June, but the pace of growth has slowed
2023-07-03
Australia’s housing values increase in June, but the pace of growth has slowed | Latest Corelogic house values
Australian housing values moved through a fourth month of recovery with CoreLogic’s national Home Value Index (HVI) rising 1.1% in June, decelerating slightly from the 1.2% gain recorded in May.
Since finding a floor in February, the national measure of housing values has gained 3.4%, however, the market remains -6.0% below peak levels recorded in April 2022.
That is the equivalent of the median dwelling value still being -$45,771 below a peak of $768,777.
Every capital city except Hobart (-0.3%) saw dwelling values rise in June, with Sydney continuing to lead the cycle.
Sydney home values increased another 1.7% in June, taking the cumulative recovery since the January trough to 6.7%. In dollar terms, Sydney’s median housing values are rising by roughly $4,262 a week
A lack of available supply continues to be the main factor keeping upwards pressure on housing values.

Australian housing values moved through a fourth month of recovery with CoreLogic’s national Home Value Index (HVI) rising 1.1% in June, decelerating slightly from the 1.2% gain recorded in May.
Since finding a floor in February, the national measure of housing values has gained 3.4%, however, the market remains -6.0% below peak levels recorded in April 2022.
That is the equivalent of the median dwelling value still being -$45,771 below a peak of $768,777.
Every capital city except Hobart (-0.3%) saw dwelling values rise in June, with Sydney continuing to lead the cycle.
Sydney home values increased another 1.7% in June, taking the cumulative recovery since the January trough to 6.7%.
In dollar terms, Sydney’s median housing values are rising by roughly $4,262 a week.

A lack of available supply continues to be the main factor keeping upwards pressure on housing values.
Through June, the flow of new capital city listings was nearly -10% below the previous five-year average and total inventory levels are more than a quarter below average.
Simultaneously, our June quarter estimate of capital city sales has increased to be 2.1% above the previous five-year average.
Although housing values continue to record a broad-based upswing, the pace of growth across most capitals eased in June.
A slowdown in the pace of capital gains could be a reflection of a change in sentiment as interest rate expectations revise higher.
Higher interest rates and lower sentiment will likely weigh on the number of active home buyers, helping to rebalance the disconnect between demand and supply.
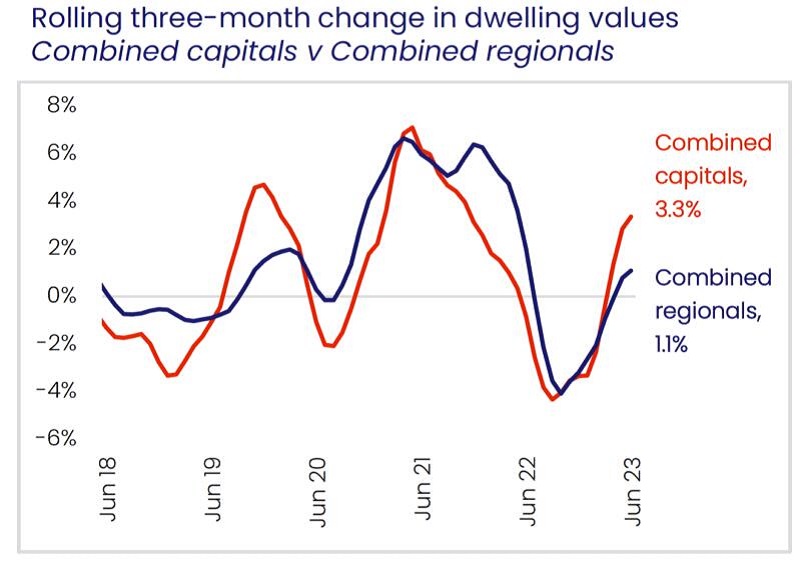
Regional housing values have also trended higher, albeit at a slower pace relative to the capitals.
The combined regionals index also recorded a fourth consecutive month of growth, taking housing values 1.2% higher than the recent low in February.
The softer growth trend across regional areas of the country align with recent shifts in demographic factors.
After regional population growth boomed through the worst of the pandemic, internal migration trends have normalised over the past year, resulting in less housing demand across regional markets.
Additionally, housing demand from overseas migration is skewed towards the capital cities rather than the regions.
Regional Victoria is the only rest of state market where quarterly housing value trends remain negative, down -0.4% in June to be -1.3% lower over the quarter.
Value declines were evident across most the SA4 sub-regions of regional Victoria, including the areas adjacent to Melbourne.
In June, Geelong home values were down -0.7%, Ballarat values fell - 0.3% and Bendigo was down -0.9%.
The weaker conditions across regional parts of the state may be related to a normalisation in migration flows as more regional residents move to the city, along with a substantial narrowing of the affordability gap between regional Victoria and Melbourne through the recent upswing.
Despite the recent uptick, most regions continue to see housing values below their recent cyclical highs.
Hobart housing values have recorded the largest cumulative decline, holding -12.9% below the record high in May last year.
Across the capital cities, Perth is the only capital where home values are at record highs, having recovered from the relatively mild -0.9% decline through the downturn.
Adelaide home values are only -0.3% below record highs and likely to reach a new high point in July.
Across the regional markets, Regional NSW is recording the largest drop from peak through to the end of June, with values down -9.6%, followed by Regional Victoria (-8.4%) and Regional Tasmania (-7.2%).
At the other end of the spectrum, dwelling values in Regional South Australia and Regional Western Australia, where housing market conditions have mostly remained positive through the rate hiking cycle to-date, recorded new cyclical highs in June.
The trend in advertised supply helps to explain the rebound in housing values.
The number of capital city homes advertised for sale over the four weeks ending June 25th was almost -20% lower than at the same time last year and -26.4% below the average for this time of the year.
Regional listings also trended lower through the month, tracking -32.9% below the previous five-year average.
Despite low inventory levels, the estimated volume of home sales is roughly in line with the previous five-year average.
Capital city homes sales were estimated to be 2.1% above the previous five-year average through the June quarter, while regional homes sales were - 8.9% below average levels.
The recovery trend is occurring across relatively thin volumes. Although homes sales are around average levels, available supply is well below.
It is this disconnect between available supply and demonstrated demand that is driving housing values higher.

The imbalance between supply and demand has seen selling conditions turn in favour of vendors rather than buyers.
Auction clearance rates are holding above average across the major auction markets and, for private treaty sales, median discounting rates have narrowed, especially across the capitals.
Auction clearance rates across the combined capitals held in the high 60% range through June, in stark contrast to late last year when clearance rates were generally below 60%.
Outside of auction markets, vendors have become less flexible on their price expectations, with capital city discounting rates tightening from -4.3% late last year to -3.6% in June.
With the flow of new listings typically subdued through winter, it is likely advertised supply levels will remain tight over the coming months.
Australian housing values moved through a fourth month of recovery with CoreLogic’s national Home Value Index (HVI) rising 1.1% in June, decelerating slightly from the 1.2% gain recorded in May.
Since finding a floor in February, the national measure of housing values has gained 3.4%, however, the market remains -6.0% below peak levels recorded in April 2022.
That is the equivalent of the median dwelling value still being -$45,771 below a peak of $768,777.
Every capital city except Hobart (-0.3%) saw dwelling values rise in June, with Sydney continuing to lead the cycle.
Sydney home values increased another 1.7% in June, taking the cumulative recovery since the January trough to 6.7%. In dollar terms, Sydney’s median housing values are rising by roughly $4,262 a week
A lack of available supply continues to be the main factor keeping upwards pressure on housing values.
Australian housing values moved through a fourth month of recovery with CoreLogic’s national Home Value Index (HVI) rising 1.1% in June, decelerating slightly from the 1.2% gain recorded in May.
Since finding a floor in February, the national measure of housing values has gained 3.4%, however, the market remains -6.0% below peak levels recorded in April 2022.
That is the equivalent of the median dwelling value still being -$45,771 below a peak of $768,777.
Every capital city except Hobart (-0.3%) saw dwelling values rise in June, with Sydney continuing to lead the cycle.
Sydney home values increased another 1.7% in June, taking the cumulative recovery since the January trough to 6.7%.
In dollar terms, Sydney’s median housing values are rising by roughly $4,262 a week.
A lack of available supply continues to be the main factor keeping upwards pressure on housing values.
Through June, the flow of new capital city listings was nearly -10% below the previous five-year average and total inventory levels are more than a quarter below average.
Simultaneously, our June quarter estimate of capital city sales has increased to be 2.1% above the previous five-year average.
Although housing values continue to record a broad-based upswing, the pace of growth across most capitals eased in June.
A slowdown in the pace of capital gains could be a reflection of a change in sentiment as interest rate expectations revise higher.
Higher interest rates and lower sentiment will likely weigh on the number of active home buyers, helping to rebalance the disconnect between demand and supply.
Regional housing values have also trended higher, albeit at a slower pace relative to the capitals.
The combined regionals index also recorded a fourth consecutive month of growth, taking housing values 1.2% higher than the recent low in February.
The softer growth trend across regional areas of the country align with recent shifts in demographic factors.
After regional population growth boomed through the worst of the pandemic, internal migration trends have normalised over the past year, resulting in less housing demand across regional markets.
Additionally, housing demand from overseas migration is skewed towards the capital cities rather than the regions.
Regional Victoria is the only rest of state market where quarterly housing value trends remain negative, down -0.4% in June to be -1.3% lower over the quarter.
Value declines were evident across most the SA4 sub-regions of regional Victoria, including the areas adjacent to Melbourne.
In June, Geelong home values were down -0.7%, Ballarat values fell - 0.3% and Bendigo was down -0.9%.
The weaker conditions across regional parts of the state may be related to a normalisation in migration flows as more regional residents move to the city, along with a substantial narrowing of the affordability gap between regional Victoria and Melbourne through the recent upswing.
Despite the recent uptick, most regions continue to see housing values below their recent cyclical highs.
Hobart housing values have recorded the largest cumulative decline, holding -12.9% below the record high in May last year.
Across the capital cities, Perth is the only capital where home values are at record highs, having recovered from the relatively mild -0.9% decline through the downturn.
Adelaide home values are only -0.3% below record highs and likely to reach a new high point in July.
Across the regional markets, Regional NSW is recording the largest drop from peak through to the end of June, with values down -9.6%, followed by Regional Victoria (-8.4%) and Regional Tasmania (-7.2%).
At the other end of the spectrum, dwelling values in Regional South Australia and Regional Western Australia, where housing market conditions have mostly remained positive through the rate hiking cycle to-date, recorded new cyclical highs in June.
The trend in advertised supply helps to explain the rebound in housing values.
The number of capital city homes advertised for sale over the four weeks ending June 25th was almost -20% lower than at the same time last year and -26.4% below the average for this time of the year.
Regional listings also trended lower through the month, tracking -32.9% below the previous five-year average.
Despite low inventory levels, the estimated volume of home sales is roughly in line with the previous five-year average.
Capital city homes sales were estimated to be 2.1% above the previous five-year average through the June quarter, while regional homes sales were - 8.9% below average levels.
The recovery trend is occurring across relatively thin volumes. Although homes sales are around average levels, available supply is well below.
It is this disconnect between available supply and demonstrated demand that is driving housing values higher.
The imbalance between supply and demand has seen selling conditions turn in favour of vendors rather than buyers.
Auction clearance rates are holding above average across the major auction markets and, for private treaty sales, median discounting rates have narrowed, especially across the capitals.
Auction clearance rates across the combined capitals held in the high 60% range through June, in stark contrast to late last year when clearance rates were generally below 60%.
Outside of auction markets, vendors have become less flexible on their price expectations, with capital city discounting rates tightening from -4.3% late last year to -3.6% in June.
With the flow of new listings typically subdued through winter, it is likely advertised supply levels will remain tight over the coming months.
- *E-mail:
- *Cel:
- *Password: