
U.S. August 2019 Existing-Home Sales
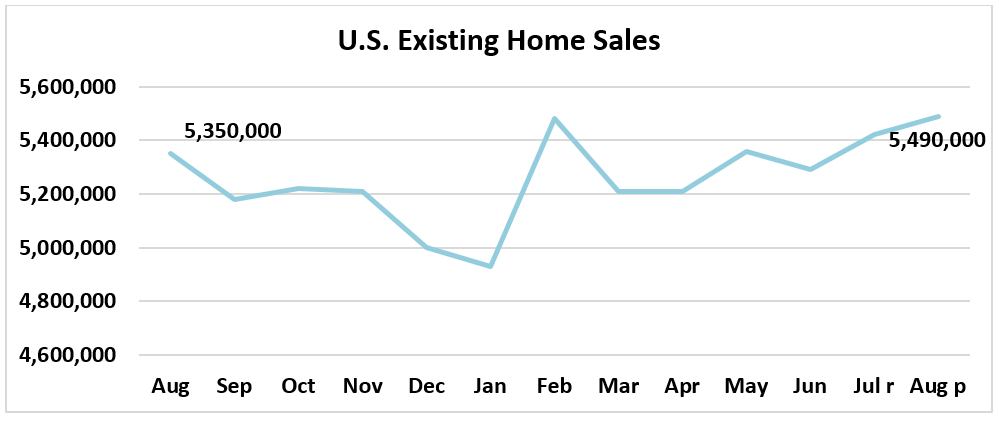
2019-09-25NAR released a summary of existing-home sales data showing that housing market activity this August rose 1.3% from July 2019. August’s sales of existing homes increased 2.6% from August 2018. August’s existing home sales reached a 5.49 million seasonally adjusted annual rate. This is the highest sales pace since March of 2018 when the index was 5.51 million.
The national median existing-home price for all housing types reached $278,200 in August, up 4.7 percent from a year ago. This marks the 90th consecutive month of year-over-year gains.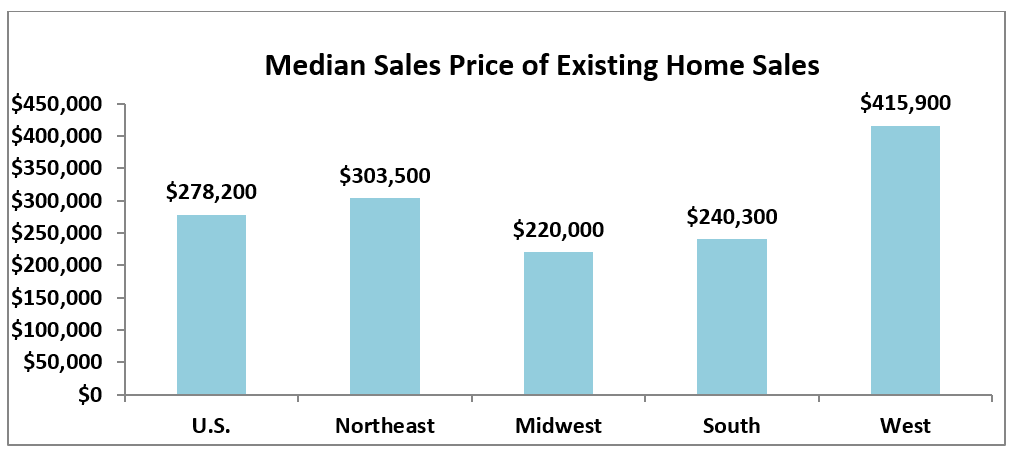
·
Regionally, three of the four regions showed growth in prices from a year ago. The Midwest had largest gain of 6.6% followed by the West with an incline of 5.7%. The South had an increase of 5.4% and the Northeast had a modest decline of 0.3% from August 2018.
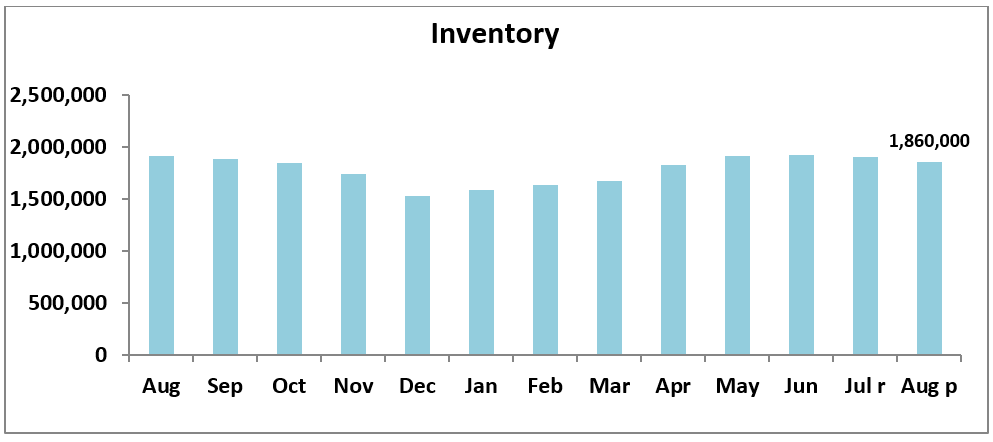
· August’s end-of-the month inventory figures fell from last month 2.1% to 1.86 million homes for sale. Compared with August of 2018, inventory levels were also down 2.6%. It will take 4.1 months to move the current level of inventory at the current sales pace. It takes approximately 31 days for a home to go from listing to a contract in the current housing market, homes only stayed on the market 29 days last year.
· From July 2019, three of the four regions showed increases in sales. The Northeast had the biggest incline in sales at 7.6%. The Midwest rose 3.1% followed by the South with a modest gain of 0.9%. The West had the only decline of 3.4%.
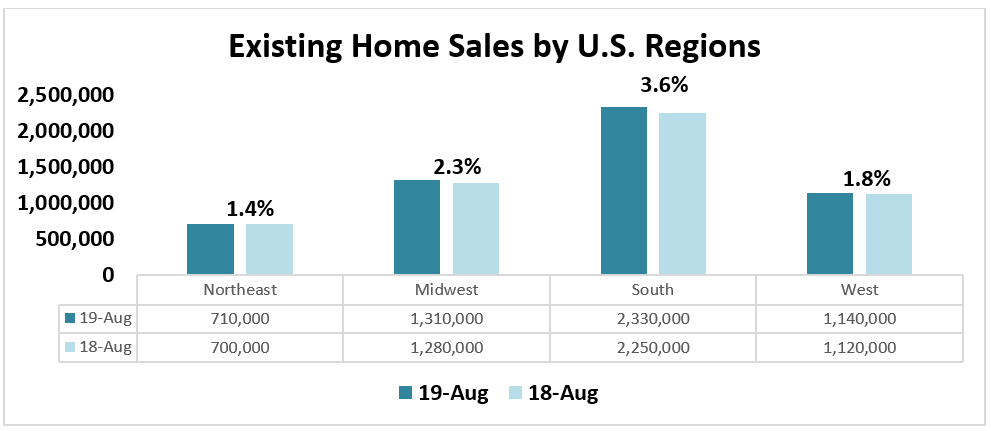
· From a year ago, all four regions showed inclines in sales. The South had the biggest gain in sales at 3.6% followed by the Midwest with a rise of 2.3%. The West rose 1.8% followed by the Northeast with the smallest increase of 1.4%. The South led all regions in percentage of national sales, accounting for 42.4 % of the total, while the Northeast had the smallest share at 12.9%.
·
IIn August, single-family sales were up 1.2% and condominiums sales were up 1.7% compared to last month. Single-family home sales were up 2.9% and condominium sales were flat compared to a year ago. Single-family homes had an increase in price up 4.7% at $280,700 and condominiums rose 5.2% at $257,600 from August 2018.
Source:NAR
- *E-mail:
- *Cel:
- *Password: